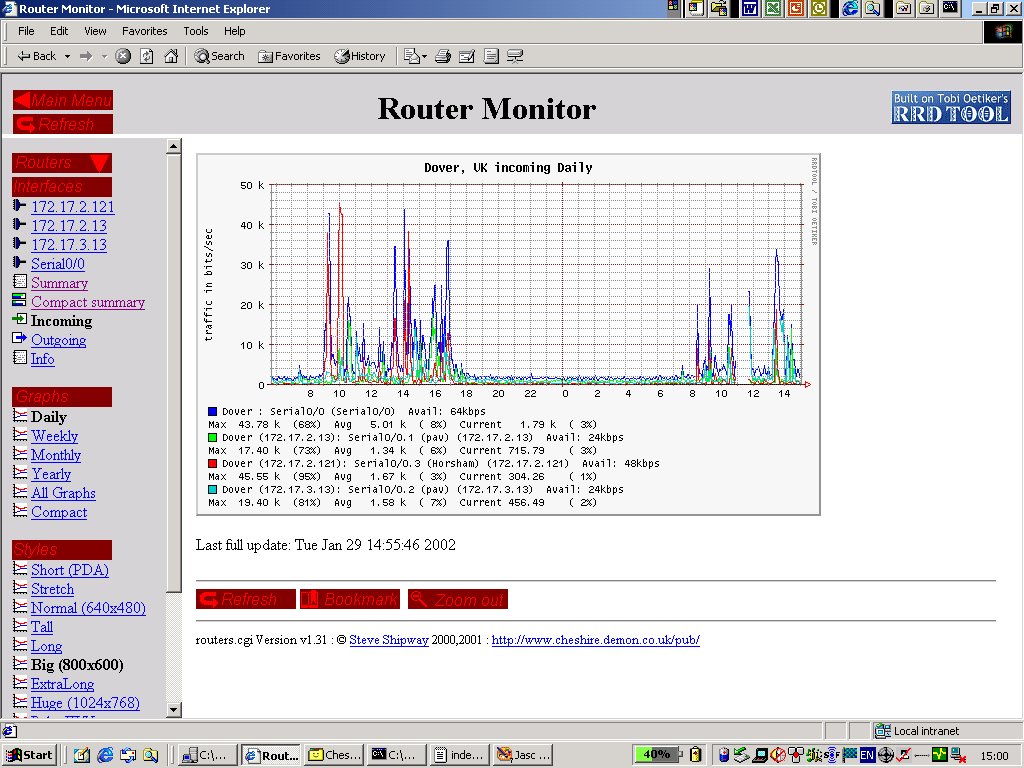
I wish to make a graph similar to the following:
http://www.steveshipway.org/software/rr ... coming.jpg
I want to stack 2 bandwidth graphs on top of each other. Currently
they are graphed individually, and each has its own config file. The
2 files are:
score1-sprint.cfg
=================
Options[score1-sprint]: noinfo,growright,bits
Target[score1-sprint]: /xxx.xxx.xxx.xxx:public@xxx.xxx.xxx.xxx:::::2
MaxBytes[score1-sprint]: 19375000
Title[score1-sprint]: Sprint
PageTop[score1-sprint]: <h2>Sprint Bandwidth</h2>
<font size=2>(POS 9/0/0)<br>
Max Speed: 155.0 Mbits/sec (POS)</font><br><br>
Directory[score1-sprint]: snip
Unscaled[score1-sprint]: dwmy
score2-uunet.cfg
================
Options[score2-uunet]: noinfo,growright,bits
Target[score2-uunet]: /xxx.xxx.xxx.xxx:public@xxx.xxx.xxx.xxx:::::2
MaxBytes[score2-uunet]: 19375000
Title[score2-uunet]: UUNet: POS8/0/0
PageTop[score2-uunet]: <h2>UUnet</h2>
<font size=2>(POS8/0/0)<br>
Max Speed: 155.0 Mbits/sec (POS)</font><br><br>
LegendI[score2-uunet]: Entering :
LegendO[score2-uunet]: Leaving :
Directory[score2-uunet]: snip
Unscaled[score2-uunet]: dwmy
How would I combine the two graphs together? In otherwords,
how can I get both bandwidth's graphed on the same image?
Thanks in advance, and thank you for the great front-end.
Joel

